Ohio's 4th congressional district
| Ohio's 4th congressional district | |
|---|---|
Interactive map of district boundaries since January 3, 2023 | |
| Representative | |
| Distribution |
|
| Population (2023) | 803,311[2] |
| Median household income | $74,281[2] |
| Ethnicity |
|
| Cook PVI | R+20[3] |
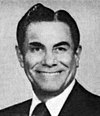
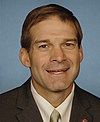
Ohio's 4th congressional district spans sections of the central part of the state. It is currently represented by Republican Jim Jordan, the current chair of the House Judiciary Committee, who has represented the district since 2007.[4]
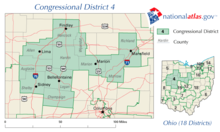
As part of the 2010 redistricting process, it was redrawn from the previous district to stretch from Lima, to include the northwestern suburbs of Columbus, up to Tiffin and Elyria.[5]
In May 2019, a panel of three federal judges ruled that Ohio's congressional district map was unconstitutional and based on gerrymandering.[6][7] A new map was expected ahead of the 2020 election.[8] However, after the U.S. Supreme Court ruled in Rucho v. Common Cause that courts could not review allegations of gerrymandering, the district boundaries would not change until congressional district maps were redrawn in 2022.[9]
Composition
[edit]For the 118th and successive Congresses (based on redistricting following the 2020 census), the district contains all or portions of the following counties, townships, and municipalities:[10]
Allen County (21)
- All 21 townships and municipalities
Ashland County (24)
- All 24 townships and municipalities
Auglaize County (22)
- All 22 townships and municipalities
Champaign County (19)
- All 19 townships and municipalities
Delaware County (21)
- Ashley, Berlin Township, Brown Township, Columbus (part; also 3rd, 12th, and 15th; shared with Fairfield and Franklin counties), Concord Township, Delaware, Delaware Township, Dublin (shared with Union County), Liberty Township, Marlboro Township, Orange Township, Ostrander, Oxford Township, Powell, Radnor Township, Scioto Township, Shawnee Hills, Thompson Township, Troy Township, Washington Township, Westerville (part; also 3rd; shared with Franklin County)
Hardin County (24)
- All 24 townships and municipalities
Logan County (30)
- All 30 townships and municipalities
Marion County (23)
- All 23 townships and municipalities
Morrow County (24)
- All 24 townships and municipalities
Richland County (29)
- All 29 townships and municipalities
Shelby County (13)
- Anna, Botkins, Dinsmore Township, Fort Loramie, Franklin Township, Jackson Township, Jackson Center, Kettlersville, McLean Township, Port Jefferson, Salem Township, Turtle Creek Township (part; also 15th), Van Buren Township
Union County (21)
- All 21 townships and municipalities
Wyandot County (4)
List of members representing the district
[edit]Recent election results
[edit]| Year | Democratic | Republican | Other(s) |
|---|---|---|---|
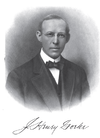
| 1910[11] | √ J. Henry Goeke: 20,865 | C. E. Johnston: 13,482 | Arthur A. Hensch: 1,403 |
| 1912[11] | √ J. Henry Goeke (inc.): 21,512 | John L. Cable: 10,267 | William E. Rudy: 4,993 Scott Williams: 2,132 W. Rollo Boehringer: 1,091 |
| 1914[11] | N. W. Cunningham: 24,114 | √ J. Edward Russell: 25,069 | Samuel L. Newman: 1,737 C. C. Hobart: 1,400 |
| 1916[11] | √ Benjamin F. Welty: 29,486 | J. Edward Russell (inc.): 25,378 | |
| 1918[11] | √ Benjamin F. Welty (inc.): 22,580 | J. Edward Russell: 22,136 | |
| 1920 | Benjamin F. Welty (inc.): 45,489 | √ John L. Cable: 50,576 | |
| 1922 | J. Henry Goeke: 35,916 | √ John L. Cable (inc.): 43,251 | |
| 1924 | Hugh T. Mathers: 42,652 | √ William T. Fitzgerald: 43,984 | |
| 1926 | Benjamin F. Welty: 31,293 | √ William T. Fitzgerald (inc.): 32,236 | |
| 1928 | William Klinger: 41,677 | √ John L. Cable: 56,291 | |
| 1930 | Gainor Jennings: 37,673 | √ John L. Cable (inc.): 43,104 | |
| 1932 | √ Frank L. Kloeb: 59,003 | John L. Cable (inc.): 49,100 | |
| 1934 | √ Frank L. Kloeb (inc.): 48,613 | Guy D. Hawley: 41,504 | |
| 1936 | √ Frank L. Kloeb (inc.): 61,927 | Robert W. Yurner: 53,352 | |
| 1938 (Special) | [data missing] | √ Walter H. Albaugh: [data missing] | [data missing] |
| 1938 | [
William B. Swonger: 33,284 |
√ Robert Franklin Jones: 56,399 | John C. Fisher: 4,616 |
| 1940 | Clarence C. Miller: 47,765 | √ Robert Franklin Jones (inc.): 65,534 | |
| 1942 | Clarence C. Miller: 22,567 | √ Robert Franklin Jones (inc.): 39,275 | |
| 1944 | Earl Ludwig: 42,983 | √ Robert Franklin Jones (inc.): 67,829 | |
| 1946 | Merl J. Bragg: 32,160 | √ Robert Franklin Jones (inc.): 64,718 | |
| 1947 (Special) | [data missing] | √ William M. McCulloch: [data missing] | [data missing] |
| 1948 | Earl Ludwig: 45,534 | √ William M. McCulloch (inc.): 57,321 | |
| 1950 | Carleton Carl Reiser: 32,686 | √ William M. McCulloch (inc.): 65,640 | |
| 1952 | Carleton Carl Reiser: 43,426 | √ William M. McCulloch (inc.): 93,442 | |
| 1954 | Forrest L. Blankenship: 32,474 | √ William M. McCulloch (inc.): 67,762 | |
| 1956 | Ortha O. Barr Jr.: 42,416 | √ William M. McCulloch (inc.): 93,607 | |
| 1958 | Marjorie Conrad Struns: 46,933 | √ William M. McCulloch (inc.): 73,448 | |
| 1960 | Joseph J. Murphy: 52,797 | √ William M. McCulloch (inc.): 99,683 | |
| 1962 | Marjorie Conrad Struns: 32,866 | √ William M. McCulloch (inc.): 77,790 | |
| 1964 | Robert H. Mihlbaugh: 64,667 | √ William M. McCulloch (inc.): 81,204 | |
| 1966 | Robert H. Mihlbaugh: 37,855 | √ William M. McCulloch (inc.): 66,142 | |
| 1968 | √ William M. McCulloch (inc.): 129,435 | ||
| 1970 | Donald B. Laws: 45,619 | √ William M. McCulloch (inc.): 82,521 | |
| 1972 | Dimitri Nicholas: 65,216 | √ Tennyson Guyer: 109,612 | |
| 1974 | James L. Gehrlich: 51,065 | √ Tennyson Guyer (inc.): 81,674 | |
| 1976 | Clinton G. Dorsey: 51,784 | √ Tennyson Guyer (inc.): 121,173 | |
| 1978 | John W. Griffin: 39,360 | √ Tennyson Guyer (inc.): 85,575 | |
| 1980 | Gerry Tebben: 51,150 | √ Tennyson Guyer (inc.): 133,795 | |
| 1981 (Special) | Dale Locker: 41,526 | √ Mike Oxley: 41.904 | |
| 1982 | Bob Moon: 57,564 | √ Mike Oxley (inc.): 105,087 | |
| 1984 | William O. Sutton: 47,018 | √ Mike Oxley (inc.): 162,199 | |
| 1986 | Clem T. Cratty: 26,320 | √ Mike Oxley (inc.): 115,751 | Raven L. Workman: 11,997 |
| 1988 | √ Mike Oxley (inc.): 160,900 | ||
| 1990 | Thomas E. Burkhart: 64,467 | √ Mike Oxley (inc.): 103,897 | |
| 1992 | Raymond M. Ball: 92,608 | √ Mike Oxley (inc.): 147,346 | |
| 1994 | √ Mike Oxley (inc.): 139,841 | ||
| 1996 | Paul Anthony McClain: 69,096 | √ Mike Oxley (inc.): 147,608 | Michael McCaffery (N): 11,057 |
| 1998 | Paul Anthony McClain: 63,529 | √ Mike Oxley (inc.): 112,011 | |
| 2000 | Daniel L. Dickman: 67,330 | √ Mike Oxley (inc.): 156,510 | Ralph Mullinger (L): 8,278 |
| 2002 | Jim Clark: 57,726 | √ Mike Oxley (inc.): 120,001 | |
| 2004 | Ben Konop: 115,422 | √ Mike Oxley (inc.): 163,459 | |
| 2006 | Richard E. Siferd: 83,929 | √ Jim Jordan: 126,542 | |
| 2008 | Mike Carroll: 93,495 | √ Jim Jordan (inc.): 177,017 | |
| 2010 | Doug Litt: 50,533 | √ Jim Jordan (inc.): 146,029 | Donald Kissick (L) 7,708 |
| 2012[12] | Jim Slone: 114,214 | √ Jim Jordan (inc.): 182,643 | Chris Kalla (L): 16,141 |
| 2014 | Janet Garrett: 60,165 | √ Jim Jordan (inc.): 125,907 | |
| 2016 | Janet Garrett: 98,981 | √ Jim Jordan (inc.): 210,227 | |
| 2018 | Janet Garrett: 89,412 | √ Jim Jordan (inc.): 167,993 | |
| 2020 | Shannon Freshour: 101,897 | √ Jim Jordan (inc.): 235,875 | Steve Perkins: 9,584 |
| 2022 | Tamie Wilson: 89,383 | √ Jim Jordan (inc.): 200,773 | |
| 2024 | Tamie Wilson: 125,905 | √ Jim Jordan (inc.): 273,297 |
Recent election results from statewide races
[edit]| Year | Office | Results[13][14][15] |
|---|---|---|
| 2008 | President | McCain 59% - 38% |
| 2012 | President | Romney 63% - 37% |
| 2016 | President | Trump 66% - 29% |
| Senate | Portman 71% - 24% | |
| 2018 | Senate | Renacci 60% - 40% |
| Governor | DeWine 65% - 32% | |
| Attorney General | Yost 68% - 32% | |
| 2020 | President | Trump 67% - 31% |
| 2022 | Senate | Vance 67% - 33% |
| Governor | DeWine 74% - 26% | |
| Secretary of State | LaRose 72% - 27% | |
| Treasurer | Sprague 71% - 29% | |
| Auditor | Faber 72% - 28% | |
| Attorney General | Yost 73% - 27% | |
| 2024 | President | Trump 68% - 31% |
| Senate | Moreno 62% - 34% |
Historical district boundaries
[edit]From 2003 to 2013 the district included the counties of Allen, Auglaize, Champaign, Hancock, Hardin, Logan, Marion, Morrow, Richland, Shelby, and part of Wyandot.[citation needed]

See also
[edit]References
[edit]- ^ "Congressional Districts Relationship Files (State-based)". U.S. Census Bureau. Archived from the original on April 2, 2013.
- ^ a b "My Congressional District".
- ^ "2022 Cook PVI: District Map and List". Cook Political Report. July 12, 2022. Retrieved January 10, 2023.
- ^ Romo, Vanessa (July 3, 2018). "Rep. Jim Jordan Denies He Knew Of Decades-Long Sexual Abuse At Ohio State". NPR. Retrieved November 13, 2019.
- ^ "Rep. Jim Jordan of Ohio learns who his dem opponent will be in November after primary". Fox News. April 29, 2020.
- ^ "Judges declare Ohio's congressional map unconstitutional". Associated Press. April 20, 2021.
- ^ "Federal judges toss out Ohio's congressional map as illegal gerrymander". May 3, 2019.
- ^ Exner, Rich (May 3, 2019). "Federal judges toss out Ohio's congressional map as illegal gerrymander". cleveland. Retrieved November 13, 2019.
- ^ Balmert, Jessie; Borchardt, Jackie (June 27, 2019). "No new maps for Ohio till 2022 after U.S. Supreme Court gerrymandering decision". Retrieved February 8, 2020.
- ^ https://www2.census.gov/geo/maps/cong_dist/cd118/cd_based/ST39/CD118_OH04.pdf
- ^ a b c d e our campaigns OH - District 4 - History
- ^ "2012 Election Results". Ohio Secretary of State.
- ^ https://davesredistricting.org/maps#viewmap::64d56870-70ea-4f4d-b667-9a4fd60ac511
- ^ https://opoliticsguru.github.io/2024-Presidential-Election-Results-Ohio/#6/42.253/-77.783
- ^ "2024 U.S. Senate Election in Ohio: Official Results".
- Martis, Kenneth C. (1989). The Historical Atlas of Political Parties in the United States Congress. New York: Macmillan Publishing Company.
- Martis, Kenneth C. (1982). The Historical Atlas of United States Congressional Districts. New York: Macmillan Publishing Company.
- Congressional Biographical Directory of the United States 1774–present


